

The pace of our modern world, and the impressive volume of data we collect on a daily basis, can be dizzying. Take for example, the hour-by-hour updates and colorful dashboards made by news outlets as they track the spread of novel coronavirus (Covid-19). Organizations need quick and consistent solutions for exploring, analyzing, and acting on their data. In this post I present a simple yet powerful solution to this modern data problem using R Markdown to generate parameterized reports. Leveraging well-maintained coronavirus data (from Johns Hopkins), let’s build our own virus dashboard that can be updated each day with just the click of a button as an example of how to build parameterized reports with R Markdown. Note: This post assumes some proficiency with R and R Markdown.
Setting up Parameters in the YAML Header
The key to automated reporting is the outlining of parameters or params in the YAML heading. The YAML heading is responsible for setting global options for any markdown document and it comes before any other code. In the example below, the YAML specifies the title, date, author, and output file type. Also included here is our params section which gives us the power to build flexible live reports.
Params allow us to quickly and easily change the output of our report. In our coronavirus example, we use a series of params that help us shape the visualizations we build later by filtering the time frame or geographic scope of the date we wish to explore.
Params can be text strings bracketed by quotation marks, logicals like TRUE or FALSE , and even R code like the Sys.Date() function which uses your systems internal calendar to pull the current date in standard R format (note that for R code to work in a param it must be preceded by !r or `r ` in your code), as shown below:
---
title: "Automated Report: Tracking Coronavirus"
author: "Red Oak Strategic"
date: "`r format(Sys.time(), '%d %B, %Y')`"
output: html_document
params:
  today: !r Sys.Date()
  yesterday: !r Sys.Date() - 1
  specific_date: !r as.Date("2020-03-21")
  country: "USA"
  state: "Virginia"
  global: TRUE
---
Using Params to Filter Data
After loading and wrangling our data to fit our needs, we have a time-series data object named cases_long which lists the cumulative number of cases in a country by date, here is a glimpse.
> cases_long %>% filter(country_region %in% "China")
# A tibble: 1,815 x 6
   province_state country_region   lat  long date       cases
   <chr>          <chr>          <dbl> <dbl> <date>     <dbl>
 1 Hubei          China           31.0  112. 2020-01-22   444
 2 Hubei          China           31.0  112. 2020-01-23   444
 3 Hubei          China           31.0  112. 2020-01-24   549
 4 Hubei          China           31.0  112. 2020-01-25   761
 5 Hubei          China           31.0  112. 2020-01-26  1058
 6 Hubei          China           31.0  112. 2020-01-27  1423
 7 Hubei          China           31.0  112. 2020-01-28  3554
 8 Hubei          China           31.0  112. 2020-01-29  3554
 9 Hubei          China           31.0  112. 2020-01-30  4903
10 Hubei          China           31.0  112. 2020-01-31  5806
# ... with 1,805 more rows
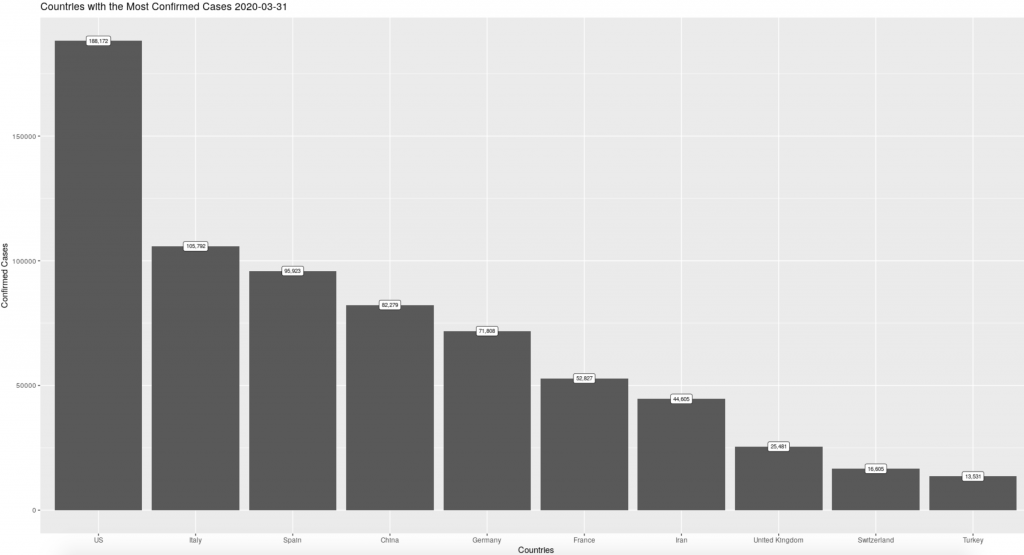
One of the charts we want to produce for our report is a bar chart that shows the count of cases in the countries with the largest outbreaks. In order to make that chart in ggplot2, we must filter our date variable to select just the date we wish to chart. To achieve this we can use any of our date params, already listed in our YAML header, to put this chart together.
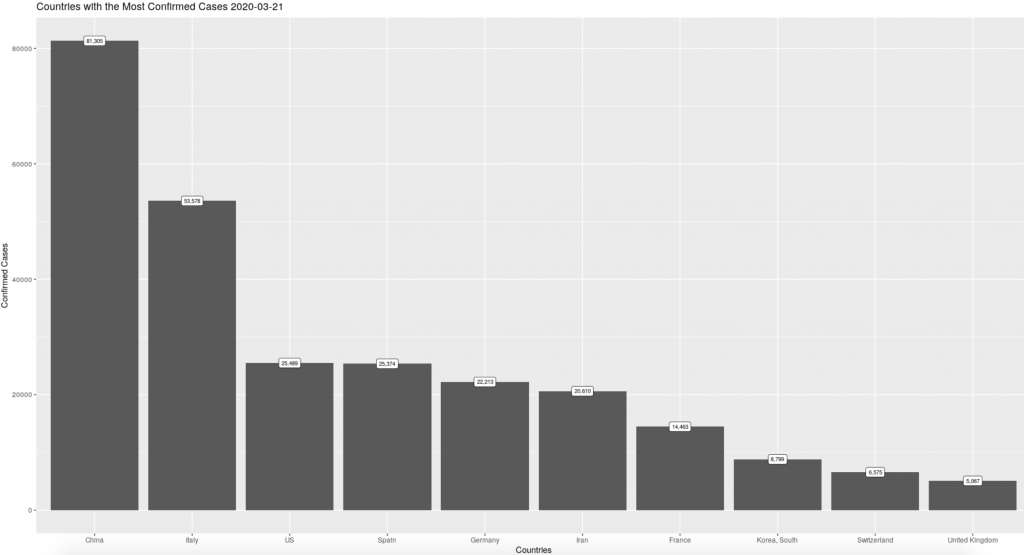
The code chunk below uses our yesterday: param to graph the counts from the most recent day of full reporting, note that we also use the same param to match the title to what the chart is showing us. If we use our specific_date: param instead (set to March 21st) we get a very different picture of the spread of the outbreak.
```{r top cases chart}

cases_long %>%
  group_by(country_region) %>%
  filter(date %in% params$yesterday) %>%
  summarise(confirmed = sum(cases)) %>%
  arrange(desc(confirmed)) %>%
  head(10) %>%
ggplot(aes(x = reorder(country_region, -confirmed), y = confirmed)) +
  geom_bar(stat = "identity") +
  labs(title = paste("Countries with the Most Confirmed Cases", params$yesterday), x = "Countries", y = "Confirmed Cases") +
  geom_label(aes(y = confirmed, label = confirmed %>% scales::comma()), size = 2.5, vjust = 0.5)

```
Using params to filter data is a helpful tool for keeping track of objects in a longer script. Instead of changing a value in multiple places, using a param can save you time and headaches by allowing you to make all of those changes in one place, at the top of your markdown script.
Params and Eval
One of the most powerful ways to create dynamic automated reports with params is to use them in chunk evaluation statements. Each code chunk in R markdown can take a series of knitr options. One such option is eval. Eval allows you to specify when you want a code chunk to be run by R as it renders to html or pdf. When done strategically, using params and eval together can allow you to keep several different styles or flavors of the same report all in one script.
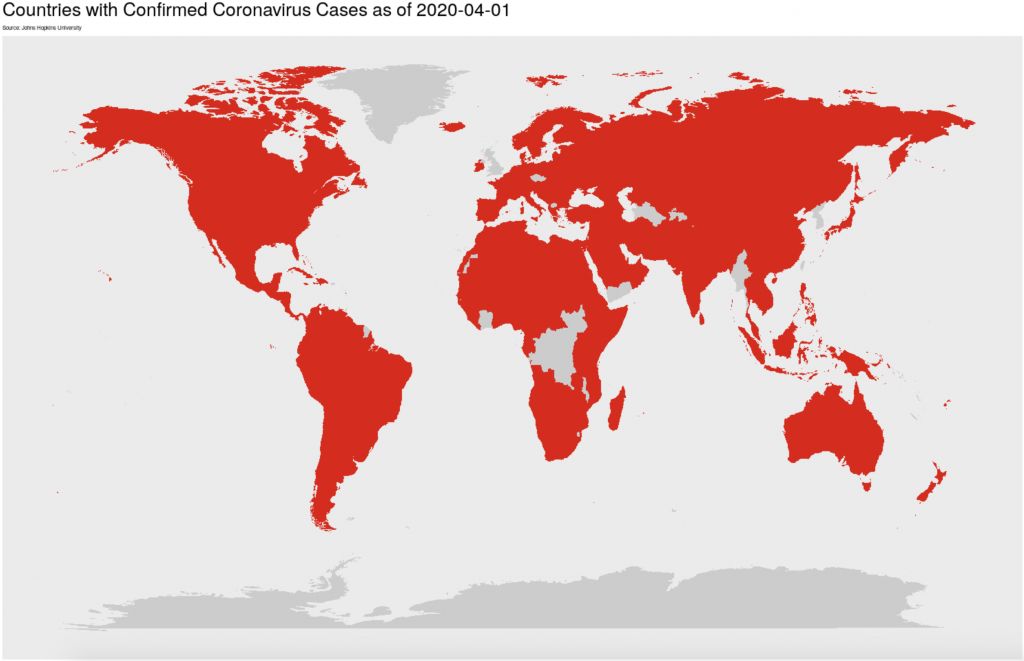
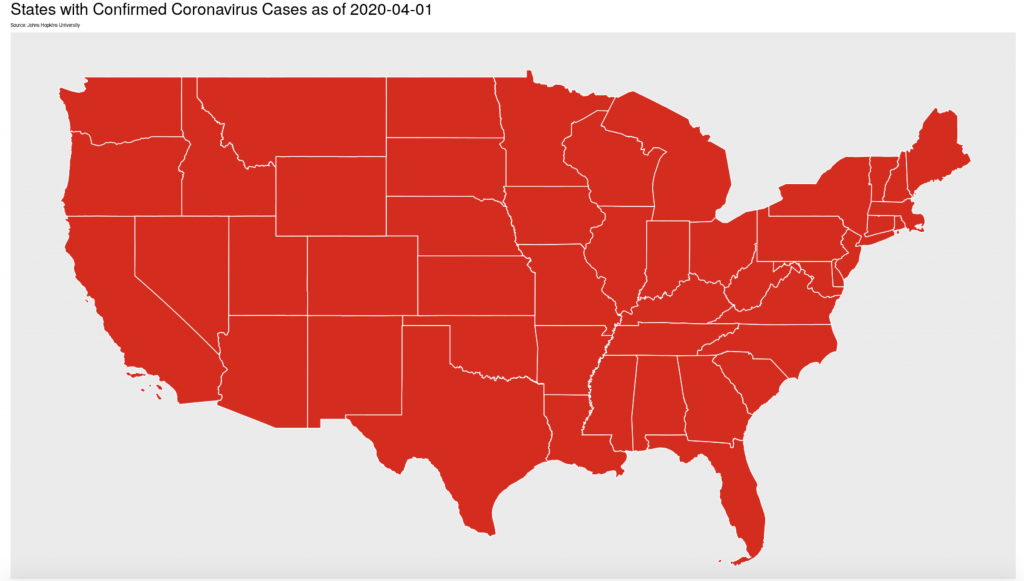
One of our params for the coronavirus report is ‘global: TRUE’ where TRUE is a logical statement. Our script has two code chunks that create maps of the virus’ spread. When the global: param is set to TRUE , a world map is created and when it is set to FALSE , a map of the United States is made instead. While both of these code chunks are in my markdown, only one will be run by R as it renders the final output. Eval is not limited to a simple true or false, you can string multiple logicals together, use other boolean functions, and as knitr package builder Yihui Xie puts it: with eval, “you can write as arbitrarily complicated expressions as you want as long as they are legitimate R code”. Eval and params allows you to store more visuals than you need while tailoring your report to your audience or your research question.
```{r global infection map, eval = params$global}

world_map_joined %>%
  ggplot(aes(x = long.x, y = lat.x, group = group, fill = infected)) +
  geom_polygon() +
  scale_fill_manual(values = c("#CCCCCC","#e60000")) +
  labs(title = paste("Countries with Confirmed Coronavirus Cases as of", params$today),
       subtitle = "Source: Johns Hopkins University") +
  theme(panel.grid = element_blank(),
        plot.title = element_text(size = 20),
        plot.subtitle = element_text(size = 6),
        axis.text = element_blank(),
        axis.title = element_blank(),
        axis.ticks = element_blank(),
        legend.position = "none")

```
```{r national infection map, eval = !params$global}

ggplot() +
  geom_sf(aes(fill = infected), data = us_join, colour = "white") +
  scale_fill_manual(values = c("#CCCCCC","#e60000")) +
  labs(title = paste("States with Confirmed Coronavirus Cases as of", params$today),
       subtitle = "Source: Johns Hopkins University") +
  scale_x_continuous(limits = c(-125, -67)) +
        scale_y_continuous(limits = c(25, 50)) +
  theme(panel.grid = element_blank(),
        plot.title = element_text(size = 20),
        plot.subtitle = element_text(size = 6),
        axis.text = element_blank(),
        axis.title = element_blank(),
        axis.ticks = element_blank(),
        legend.position = "none")

```
Practical Use Cases and Extensions
Parameterized reports are a must for any organization that wants to make the best use of their data. They can serve as anything from a basic diagnostic tool for quick exploratory analysis to a clean and consistent final product and help improve the pace and consistency with which you digest dynamic data.
This post is only a simple introduction to a powerful set of tools. The following links are great places to start for those looking to explore R Markdown, knitr, and/or params in more depth. I also welcome you to download and expand on the coronavirus markdown used in this post from our GitHub as a way of tracking the virus and building your skills. As always, we’d love to hear from you, so contact us today! Stay safe and stay healthy!
Contact Red Oak Strategic
.png)
Analytics
AWS Summit 2026 Reflection: From Possibility to Production Execution Last year at AWS Summit in Washington, DC, the AI conversation still ha...

Data
Introduction This is the first installment of a three-part technical series detailing the end-to-end observability and log tracking architec...


Data
The Problem: AI Pilots Are Easy to Start and Hard to Scale AI is no longer a future-state conversation for most organizations. Leadership te...
