Table of Contents
Need Help? Get in Touch!

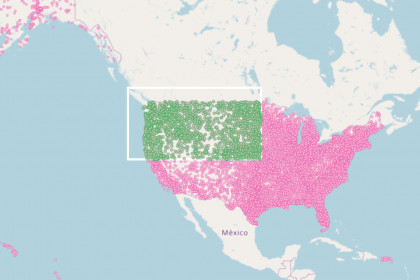
Our team recently designed a dashboard using R Shiny Leaflet allowing users to select many locations at one go on an interactive map. We created the map using the package leaflet.extras, which enables users to draw shapes on R Shiny Leaflet maps. When combined with the package sp and a function called findLocations, the leaflet.extras drawing tool can be used as a bounding box to select any area on a Shiny Leaflet map and to highlight and identify all locations in that area.
The function findLocations was created from this solution on StackOverflow. This function is now available in an R package called geoshaper , which can be installed from GitHub.
Below is a reproducible code sample incorporating this R Shiny Leaflet approach to multiple location selection.
Data Prep
Our sample dataset has three columns: an airport code, longitude, and latitude for airports in the United States.
After we read in this dataset, we’ll create a fourth column called secondLocationID. We’ll need this second set of unique id’s to color the locations we select. The reason for this is that the new color is not a color change, but a newly added map layer. Each location in our dataset could at any point in time be represented by either one or two layers, so each one needs two unique id’s.
The other important variable is coordinates. This is a SpatialPointsDataFrame created from the data stored in airports. It contains all the locations in the master dataset. It will be passed to the function findLocations as the second parameter.
library(shiny)
library(leaflet)
library(leaflet.extras)
library(sp)

# source: https://opendata.socrata.com/dataset/Airport-Codes-mapped-to-Latitude-Longitude-in-the-/rxrh-4cxm
airports <- read.csv('Airport_Codes_mapped_to_Latitude_Longitude_in_the_United_States.csv')

# longitudinal coordinates in dataset are off, reverse to negative values to place them in the western hemisphere
airports$Longitude <- airports$Longitude - 2 * airports$Longitude

# generate second set of unique location IDs for second layer of selected locations
airports$secondLocationID <- paste(as.character(airports$locationID), "_selectedLayer", sep="")

coordinates <- SpatialPointsDataFrame(airports[,c('Longitude', 'Latitude')] , airports)

head(airports)
The Map
Below is the code for making a map in Shiny with drawing tools to highlight all locations found inside an any given area.
Scroll down to try it out! (The basic code flow is also explained below the map.)
shinyApp(
ui <- fluidPage(
  leafletOutput("mymap")
  ),

server <- function(input, output) {

  ################################################# section one #################################################
  # list to store the selections for tracking
  data_of_click <- reactiveValues(clickedMarker = list())

  ################################################# section two #################################################
  # base map
  output$mymap <- renderLeaflet({
    leaflet() %>%
      addTiles() %>%
      addCircles(data = airports,
                 radius = 1000,
                 lat = airports$Latitude,
                 lng = airports$Longitude,
                 fillColor = "white",
                 fillOpacity = 1,
                 color = "hotpink",
                 weight = 2,
                 stroke = T,
                 layerId = as.character(airports$locationID),
                 highlightOptions = highlightOptions(color = "mediumseagreen",
                                                     opacity = 1.0,
                                                     weight = 2,
                                                     bringToFront = TRUE)) %>%
      addDrawToolbar(
        targetGroup='Selected',
        polylineOptions=FALSE,
        markerOptions = FALSE,
        polygonOptions = drawPolygonOptions(shapeOptions=drawShapeOptions(fillOpacity = 0
                                                                          ,color = 'white'
                                                                          ,weight = 3)),
        rectangleOptions = drawRectangleOptions(shapeOptions=drawShapeOptions(fillOpacity = 0
                                                                              ,color = 'white'
                                                                              ,weight = 3)),
        circleOptions = drawCircleOptions(shapeOptions = drawShapeOptions(fillOpacity = 0
                                                                          ,color = 'white'
                                                                          ,weight = 3)),
        editOptions = editToolbarOptions(edit = FALSE, selectedPathOptions = selectedPathOptions()))
  })

  ############################################### section three #################################################
  observeEvent(input$mymap_draw_new_feature,{
    #Only add new layers for bounded locations
    found_in_bounds <- findLocations(shape = input$mymap_draw_new_feature
                      , location_coordinates = coordinates
                      , location_id_colname = "locationID")

    for(id in found_in_bounds){
      if(id %in% data_of_click$clickedMarker){
        # don't add id
      } else {
        # add id
        data_of_click$clickedMarker<-append(data_of_click$clickedMarker, id, 0)
      }
    }

    # look up airports by ids found
    selected <- subset(airports, locationID %in% data_of_click$clickedMarker)

    proxy <- leafletProxy("mymap")
    proxy %>% addCircles(data = selected,
                        radius = 1000,
                        lat = selected$Latitude,
                        lng = selected$Longitude,
                        fillColor = "wheat",
                        fillOpacity = 1,
                        color = "mediumseagreen",
                        weight = 3,
                        stroke = T,
                        layerId = as.character(selected$secondLocationID),
                        highlightOptions = highlightOptions(color = "hotpink",
                                                            opacity = 1.0,
                                                            weight = 2,
                                                            bringToFront = TRUE))

  })

  ############################################### section four ##################################################
  observeEvent(input$mymap_draw_deleted_features,{
    # loop through list of one or more deleted features/ polygons
    for(feature in input$mymap_draw_deleted_features$features){

        # get ids for locations within the bounding shape
        bounded_layer_ids <- findLocations(shape = feature
                        , location_coordinates = coordinates
                        , location_id_colname = "secondLocationID")


        # remove second layer representing selected locations
        proxy <- leafletProxy("mymap")
        proxy %>% removeShape(layerId = as.character(bounded_layer_ids))

        first_layer_ids <- subset(airports, secondLocationID %in% bounded_layer_ids)$locationID

        data_of_click$clickedMarker <- data_of_click$clickedMarker[!data_of_click$clickedMarker
                                                                   %in% first_layer_ids]
      }
  })
},

  options = list(height = 400)
)
The first and shortest step is to initialize the reactive list data_of_click$clickedMarker. The purpose of this reactive list is to serve as a kind of “click memory” and prevent the re-addition of the same location id’s to the running record of locations found (in case the user draws overlapping shapes).
In the second section, we create our base map, complete with our drawing toolbar as well as all the locations displayed as pink circles on the map. Each pink circle on our map has a unique layer id (the airport code from the locationID column in the airports dataframe).
In the third section, we define our first observeEvent function. This function tells our R Shiny Leaflet app that if the user draws a new shape on the map, to call the findLocations function and return all the unique layer id’s for all the pink circles inside that new shape. It then checks if those id’s are already in data_of_click$clickedMarker. If they aren’t, it adds them and uses the updated data_of_click$clickedMarker to look up the locations in the original dataset. It then modifies our Leaflet map using the leafletProxy function, drawing new green circles over the selected pink ones and assigning the id’s from the secondLocationID column to the green circles.
The fourth and final section contains a second observeEvent function that controls the removal of any green circles inside shapes that the user deletes from the map. Since the user may choose to delete more than one shape at a time (the DrawToolbar has a “Clear All” button), we have written a for loop that goes through the shapes to be deleted and applies the findLocations function to each shape found. This time, the id’s the app will be looking for are from secondLocationID. After removing the green circles found inside the deleted shapes, the app will also look up the primary id’s corresponding to the secondary id’s in the original dataset and remove them from its running record of currently selected locations, data_of_click$clickedMarker.
The Function that Makes It Possible
Our team found this solution on StackOverflow while working on adding a multiple location selection feature to a R Shiny Leaflet map. We have used it in different Shiny projects and decided to convert it into a reusable function.
The function takes three parameters:
1) shape is always a Shiny input (either a shape that has been drawn or deleted from the map).
2) location_coordinates is a SpatialPointsDataFrame containing lat/long coordinates and id’s for all locations appearing on the map.
3) location_id_colname is the column name from location_coordinates containing the layer id’s for the locations to be found and returned.
The function identifies the shape, derives boundary-defining geospatial coordinates from shape, and checks which geospatial coordinates from location_coordinates are within the boundaries of the shape.
The function returns a vector of location id’s.
# function for finding the locations inside the shapes we draw
findLocations <- function(shape, location_coordinates, location_id_colname){

  # derive polygon coordinates and feature_type from shape input
  polygon_coordinates <- shape$geometry$coordinates
  feature_type <- shape$properties$feature_type

  if(feature_type %in% c("rectangle","polygon")) {

    # transform into a spatial polygon
    drawn_polygon <- Polygon(do.call(rbind,lapply(polygon_coordinates[[1]],function(x){c(x[[1]][1],x[[2]][1])})))

    # use 'over' from the sp package to identify selected locations
    selected_locs <- sp::over(location_coordinates
                              , sp::SpatialPolygons(list(sp::Polygons(list(drawn_polygon),"drawn_polygon"))))

    # get location ids
    x = (location_coordinates[which(!is.na(selected_locs)), location_id_colname])

    selected_loc_id = as.character(x[[location_id_colname]])

    return(selected_loc_id)

  } else if (feature_type == "circle") {

    center_coords <- matrix(c(polygon_coordinates[[1]], polygon_coordinates[[2]])
                            , ncol = 2)

    # get distances to center of drawn circle for all locations in location_coordinates
    # distance is in kilometers
    dist_to_center <- spDistsN1(location_coordinates, center_coords, longlat=TRUE)

    # get location ids
    # radius is in meters
    x <- location_coordinates[dist_to_center < shape$properties$radius/1000, location_id_colname]

    selected_loc_id = as.character(x[[location_id_colname]])

    return(selected_loc_id)
    }
}
Potential Applications
This visualization tool allows users to instantly group and subset a dataset based on location.
In our example above, our dataframe is limited to the minimum information required to render the locations on the map and activate the drawing tools for multiple selection. If we had a larger dataframe with additional data associated with each airport location, however, we could easily use this drawing tool as a means to extract data from the locations returned. For example, we could have airport operations data associated with each of our airport codes. We could then pass operations data for any subset of locations to be displayed elsewhere in the app as graphs or tables.
To try out this kind of visualization with your own data in R Shiny Leaflet, download geoshaper to RStudio by typing the command:
library(devtools)
install_github("RedOakStrategic/geoshaper")

Contact Red Oak Strategic
From cloud migrations to machine learning & AI - maximize your data and analytics capabilities with support from an AWS Advanced Tier consulting partner.
Related Posts
Machine Learning

Tyler Sanders
Machine Learning

Tyler Sanders
Ready to get started?
Kickstart your cloud and data transformation journey with a complimentary conversation with the Red Oak team.


