


Introduction
This final installment in the series focuses on the visualization and operationalization of gathered telemetry. It details how the underlying log tracking architecture is surfaced through Amazon Quick, utilizing SPICE-backed datasets, private VPC networking, and AI-powered exploration tools to transform raw technical data into actionable business insights for pipeline health and cost management.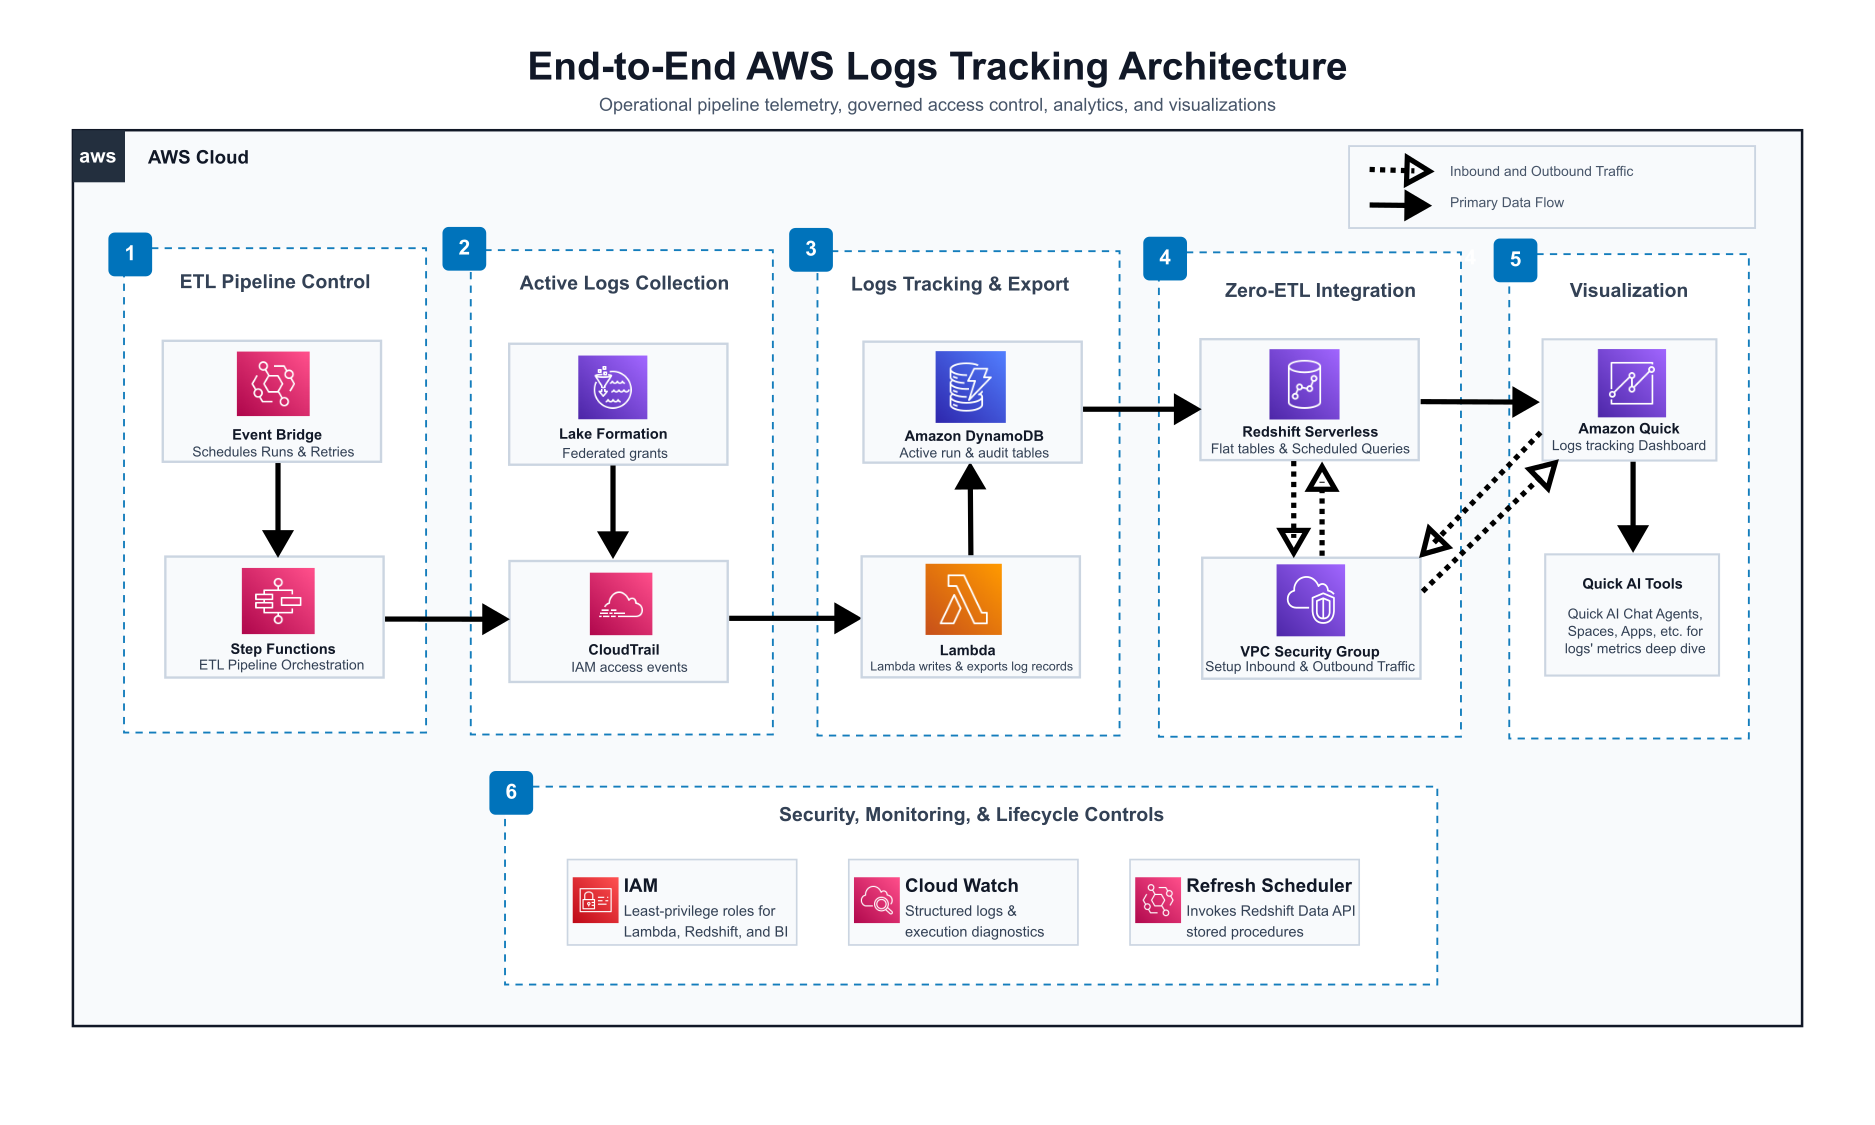
1. VPC Networking: Redshift and Amazon Quick Security Groups
Connectivity between Redshift Serverless and Amazon Quick is secured through VPC security groups with explicit inbound and outbound rules. This section describes the networking layer that enables Amazon Quick to query Redshift without traversing the public internet.
1.1 Redshift Security Group
The Redshift workgroup is attached to a pre-existing security group within the dev VPC. Enhanced VPC routing is enabled, forcing all COPY, UNLOAD, and Redshift Spectrum traffic through the VPC. The security group must permit:
- Inbound: TCP port 5439 from the Amazon Quick VPC CIDR range or the Amazon Quick security group ID.
- Outbound: TCP port 443 to S3 VPC endpoints for Spectrum and UNLOAD operations.
- Outbound: TCP port 443 to Glue VPC endpoints for catalog access.
- Outbound: TCP port 443 to Secrets Manager endpoints for credential retrieval.m
CLI: Configure Security Groups for Redshift and Amazon Quick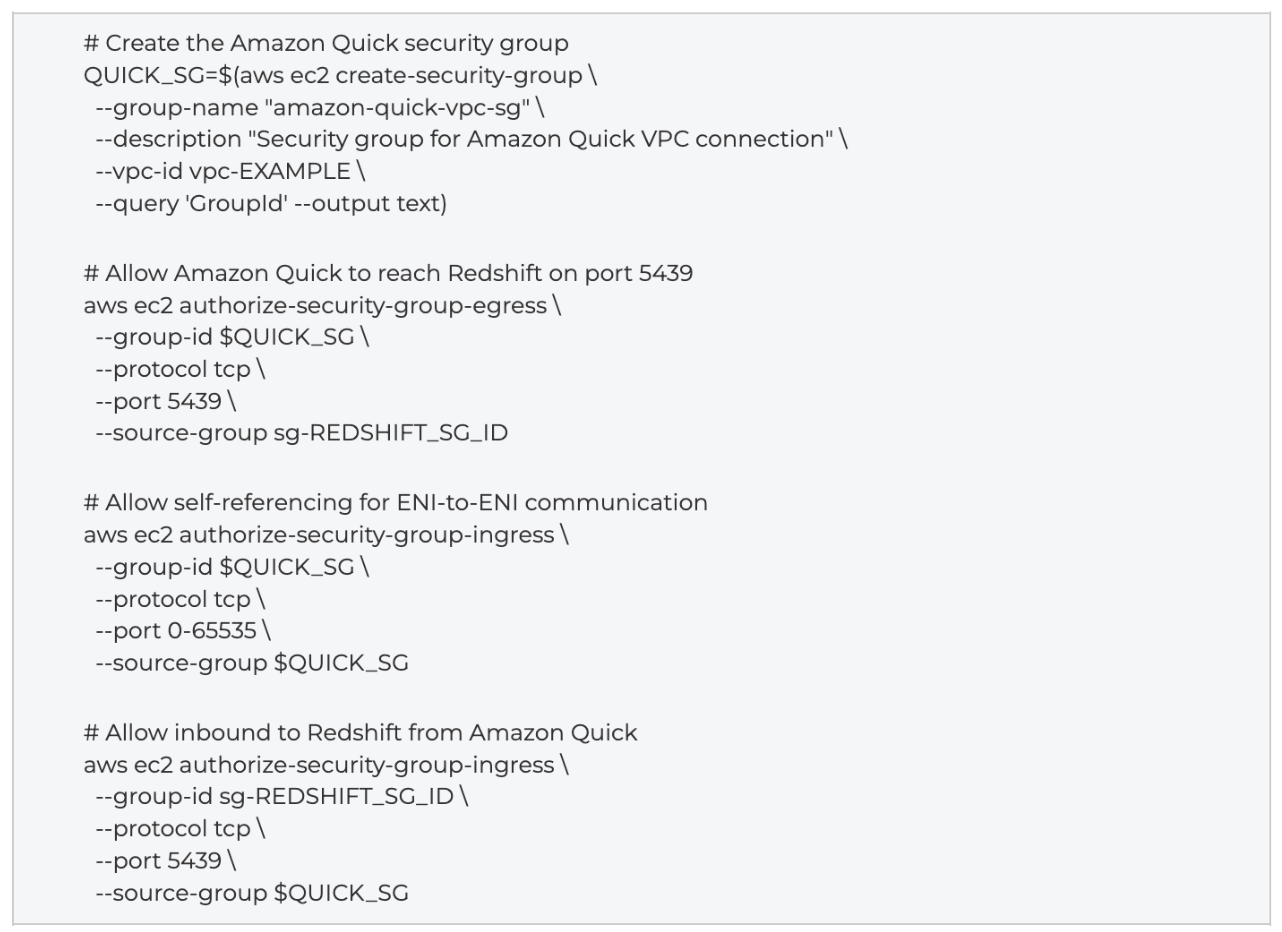 1.2 Amazon Quick VPC Connection
Amazon Quick requires a VPC connection to access Redshift within a private subnet. This is configured through the Amazon Quick managed VPC settings in the admin console.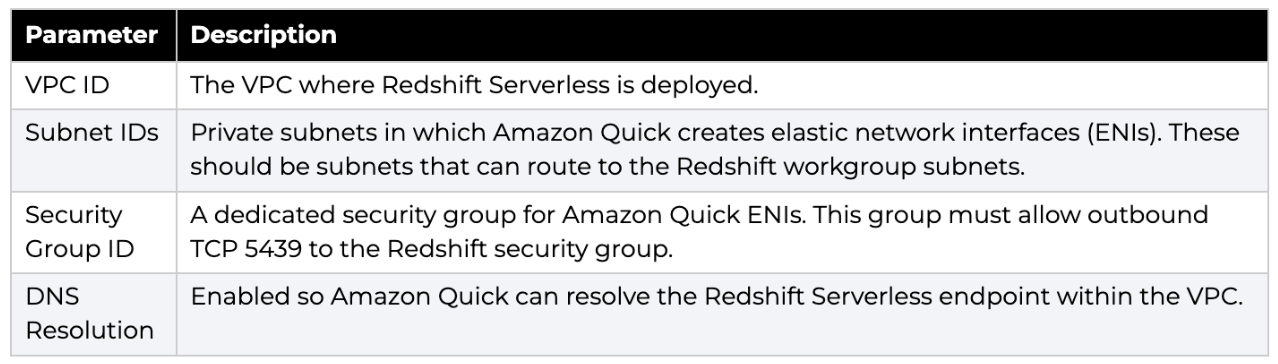
1.3 Inbound and Outbound Rules Summary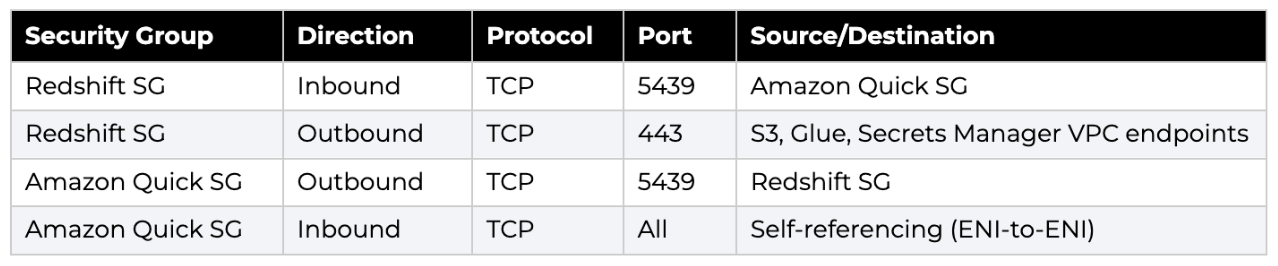
2. Amazon Quick Dataset Ingestion and SPICE Scheduling
Once the VPC connection is in place, datasets are created in Amazon Quick by pointing to Redshift as the data source. The ingestion process involves selecting the Redshift connection type, providing VPC and credential details, defining the dataset SQL, and configuring SPICE refresh schedules.
2.1 Data Source Configuration
- Connection type: Amazon Redshift (manual connect).
- Connection method: VPC connection.
- Redshift endpoint: The Redshift Serverless workgroup endpoint.
- Database name: dev (or the target database).
- Credentials: Username and password stored in Secrets Manager.
CLI: Create Amazon Quick Data Source for Redshift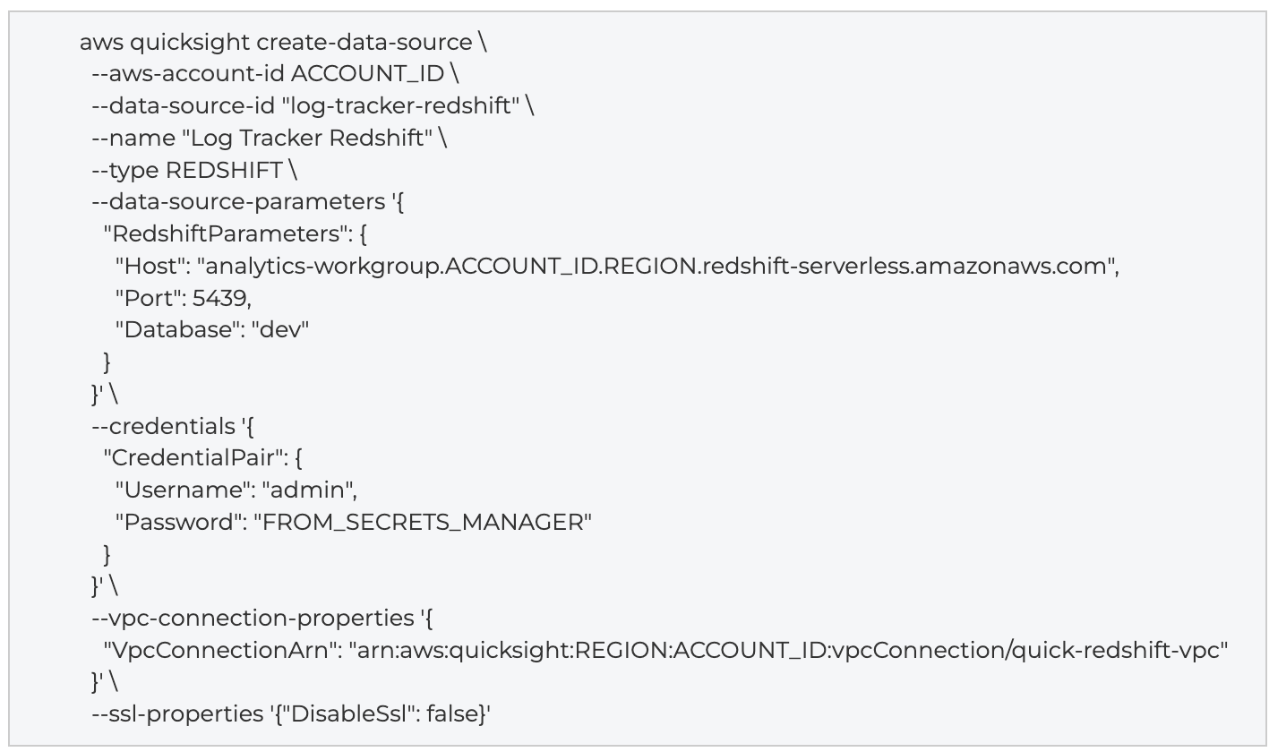 2.2 Dataset SQL and Import Mode
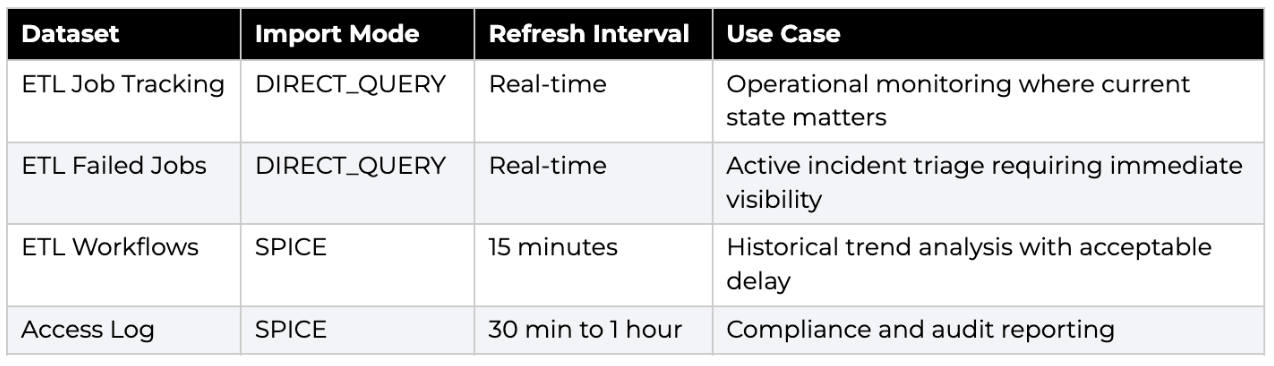 CLI: Create a SPICE Dataset with Refresh Schedule
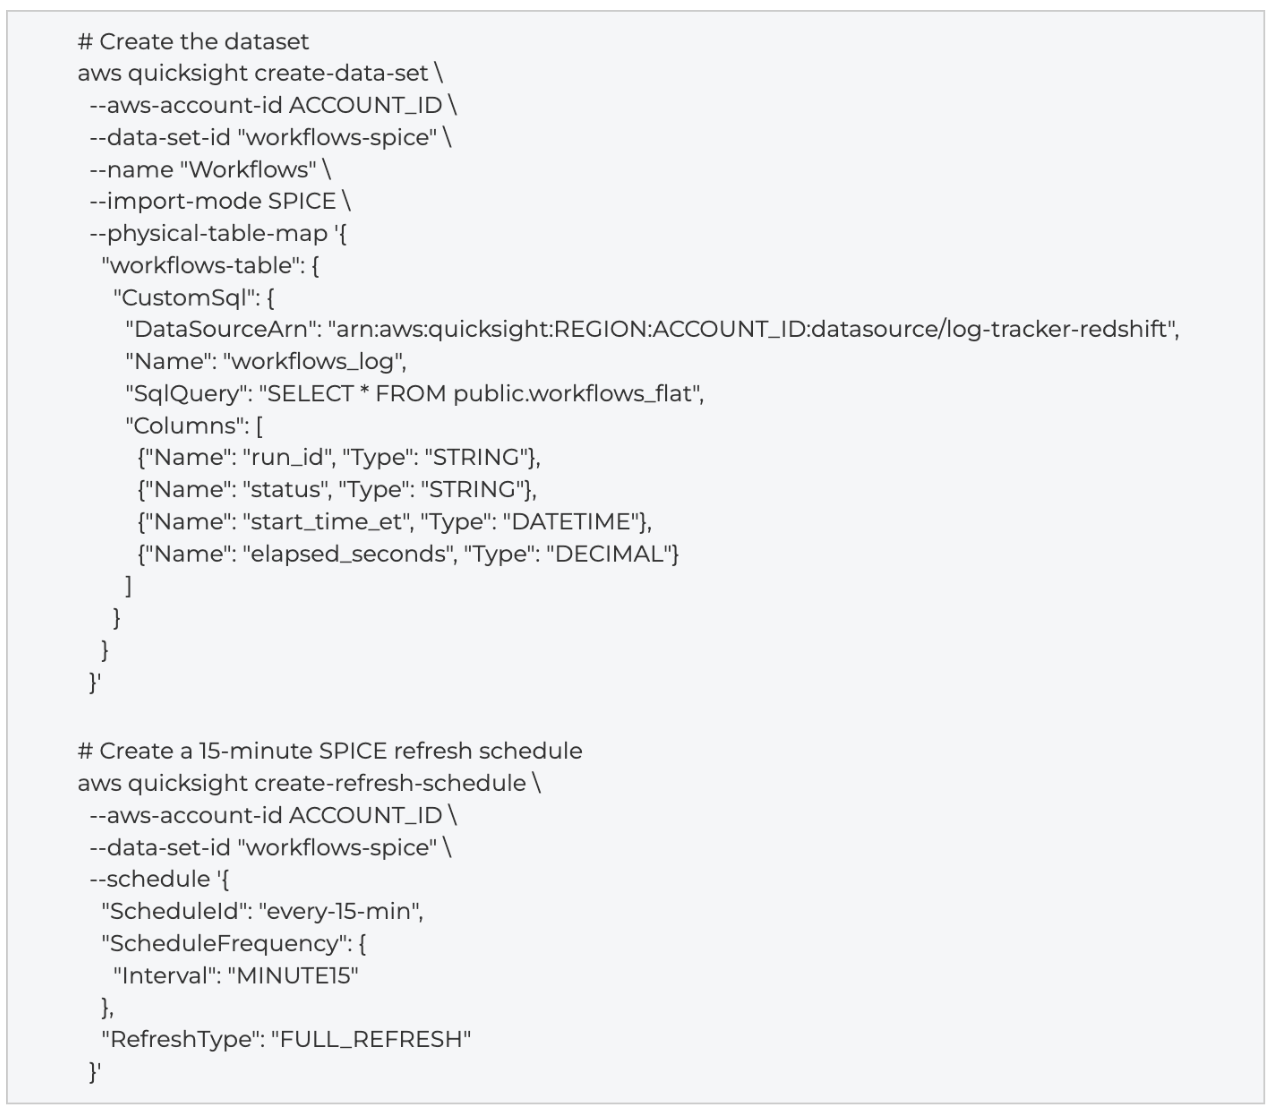 2.3 SPICE Refresh Scheduling
For SPICE-backed datasets, incremental refresh schedules are configured in the Amazon Quick Datasets section. SPICE capacity is allocated at the account level and shared across all datasets. The dev environment provisions enough SPICE capacity to hold the full working set without eviction.
3. Dashboard Publishing and Amazon Quick AI Tools
Log tracking dashboards are published as separate Amazon Quick dashboards, one per vertical or operational concern. Each dashboard is built from an analysis that references one or more datasets, and publishing creates a read-only view shareable with specific users or groups. This centralized visualization is vital because it converts raw, disparate telemetry into a unified narrative that stakeholders can use to verify pipeline health and resource utilization without needing direct access to backend systems.
3.1 Dashboard Verticals
- ETL Job Tracking: Monitors pipeline execution across all table-level ETL jobs. Shows success/failure rates, duration trends, records processed, and scan costs.
- ETL Failed Jobs: Focuses on failures with error categorization, retry counts, time-to-resolution metrics, and quarantine status.
- ETL Workflows: Displays workflow-level execution patterns including full-refresh vs. delta modes, source-to-target mappings, and elapsed time distributions.
- Access Log (LakeFormation): Tracks IAM and LakeFormation access events including allowed/denied outcomes, user types, event categories, and AWS region.
- Pipeline Jobs: Aggregates pipeline stage telemetry across all data sources with cross-source comparison.
3.2 Amazon Quick AI Tools
Amazon Quick provides a suite of AI-powered tools that extend the log tracking dashboards beyond traditional BI visualizations. These tools allow users to explore log metrics through natural language, build collaborative workspaces, and create lightweight applications on top of the dashboard data.
3.2.1 Chat Agents (Amazon Q in Quick)
Chat Agents enable natural language queries against the log tracking datasets. Users can ask questions such as "Which pipelines failed most often last week?" or "Show me the average duration for Source Alpha extracts" without writing SQL or building custom visuals. Chat Agents use the dataset metadata and SPICE data to generate answers and visualizations on the fly.
3.2.2 Spaces
Spaces provide collaborative workspaces where teams can organize dashboards, analyses, and datasets by project or operational concern. The log tracking architecture uses Spaces to group all ETL monitoring dashboards under a single workspace, making it easy for on-call engineers to find the relevant views without navigating the full Amazon Quick asset catalog.
3.2.3 Apps
Amazon Quick Apps allow teams to build lightweight, interactive applications on top of dashboard data. For the log tracking use case, an App can provide a guided troubleshooting workflow: select a pipeline, view recent failures, drill into error details, and trigger a retry directly from the interface (via an API Gateway integration). Apps surface the same SPICE and direct-query data as dashboards but with a more targeted, task-oriented user experience.
3.3 Backup and Recovery
A nightly EventBridge-triggered Lambda function exports all Amazon Quick analyses, dashboards, and themes to S3. This backup covers both the dashboard definitions and their dataset configurations, enabling recovery from accidental deletion without rebuilding from scratch.
4. CloudTrail Log Collection Strategies
CloudTrail provides the authoritative audit trail for all API calls across the AWS account. This architecture treats CloudTrail as the source for LakeFormation access telemetry. This audit capability is essential for identifying security anomalies; for instance, it allows engineers to investigate a situation where suspicious permission changes or unauthorized attempts to access sensitive data lake resources must be reviewed and remediated.
4.1 CloudTrail Configuration
A multi-region trail is provisioned through a Step Function state machine that checks whether the trail exists via the CloudTrail DescribeTrails API and creates it if absent. The trail writes to an account-scoped S3 bucket. GuardDuty is enabled alongside CloudTrail to surface HIGH and MEDIUM severity findings through EventBridge rules routed to SNS.
4.2 Cost of Full CloudTrail Ingestion to DynamoDB
Writing all CloudTrail events directly to DynamoDB is expensive:
- Volume: A moderately active AWS account generates tens of millions of CloudTrail events per day.
- Storage: CloudTrail events are verbose, with request parameters that inflate item sizes.
- Retention: Even 30 days of CloudTrail data in DynamoDB at scale consumes terabytes.
For these reasons, the dev architecture does not route raw CloudTrail events to DynamoDB. Instead, a targeted polling strategy is used.
4.3 Access Events (Targeted CloudTrail Extraction)
A dedicated Lambda poller queries CloudTrail for specific event types related to LakeFormation access decisions. This targeted extraction reduces volume by orders of magnitude compared to full CloudTrail ingestion. The poller writes structured access records to a dedicated DynamoDB table (access-events) that is then replicated to Redshift via Zero-ETL and surfaced through the Access Log dashboard.
Sample: Access Events Lambda (Python)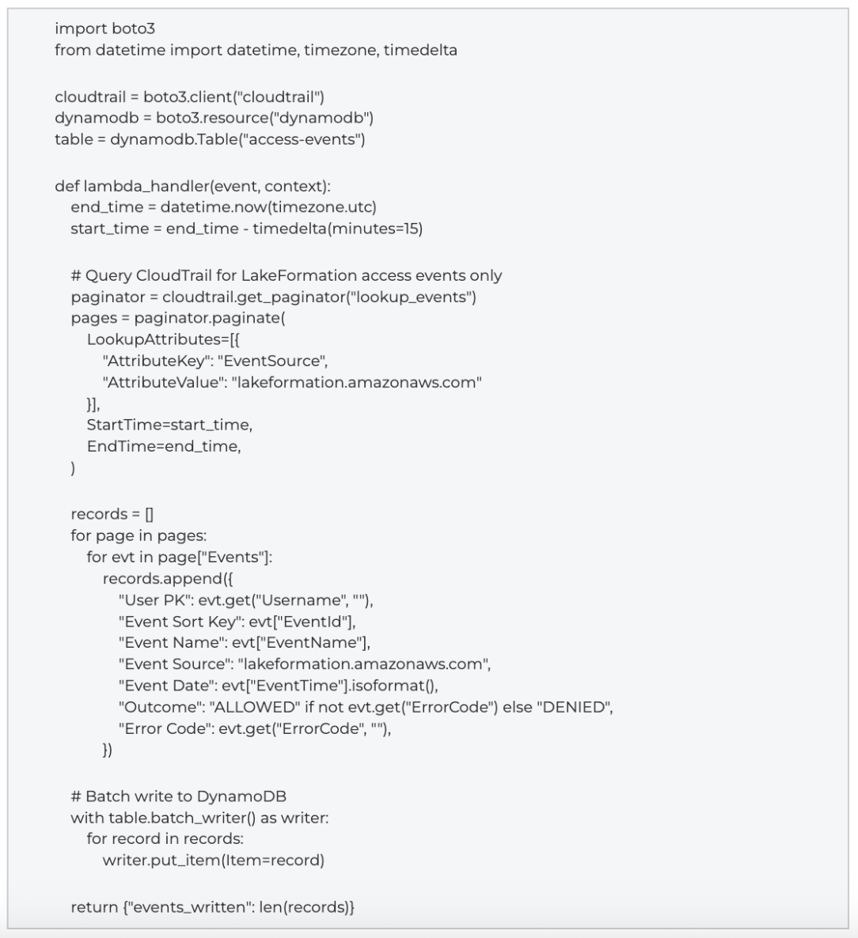
5. Direct Lambda and Step Function Log Exports
In addition to the CloudTrail polling and Zero-ETL replication paths, Lambda functions and Step Functions generate operational logs directly within their execution code and state machine definitions. These direct exports capture domain-specific telemetry that CloudTrail does not cover.
5.1 In-Code Logging to DynamoDB (PipelineLogger)
Every ETL pipeline Lambda writes structured log records to DynamoDB through the PipelineLogger module. The record is written before the function returns its response, ensuring that even failed executions produce a FAILED record with error details. This avoids the latency and cost of parsing CloudWatch Logs after the fact.
5.2 Step Functions Direct DynamoDB Writes
Step Functions state machines write directly to DynamoDB at multiple stages (InitJob, UpdateProgress, DevSucceeded, DevFailed) using SDK service integrations. These writes bypass Lambda entirely, reducing latency and cost for status updates that do not require compute logic. The direct writes follow the same DynamoDB table schema as PipelineLogger, ensuring that all records -- whether written by Lambda or Step Functions -- are captured by the Zero-ETL integration and flow through to the Redshift flat tables.
5.3 CloudWatch Structured Logging
Lambda functions also emit structured JSON logs to CloudWatch Logs through standard Python logging. Step Function execution logs are configured in CloudWatch with a 7-day retention period. The logging level for state machine payload is set to OFF (to avoid logging sensitive data) but the CloudWatch log group captures state transitions for audit.
Sample: Structured CloudWatch Logging (Python)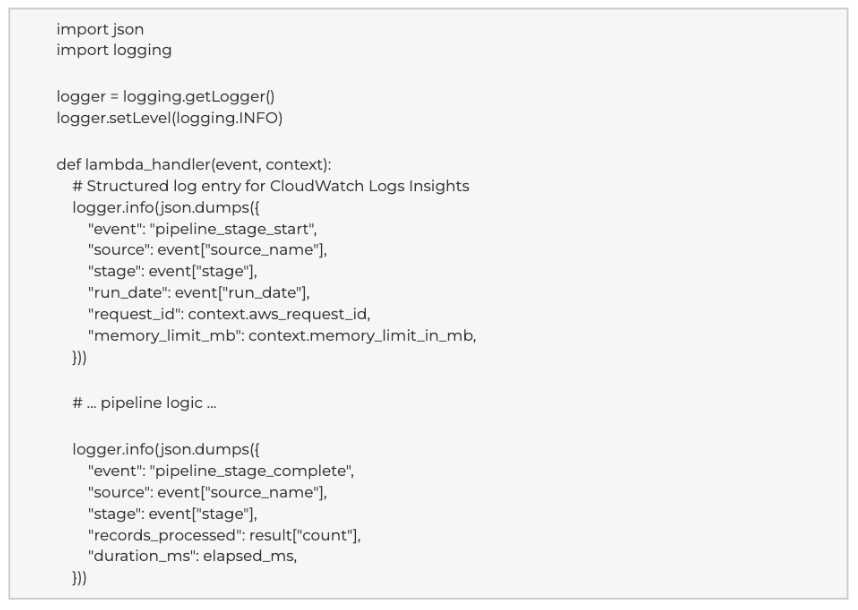
CLI: Query CloudWatch Logs Insights for Pipeline Failures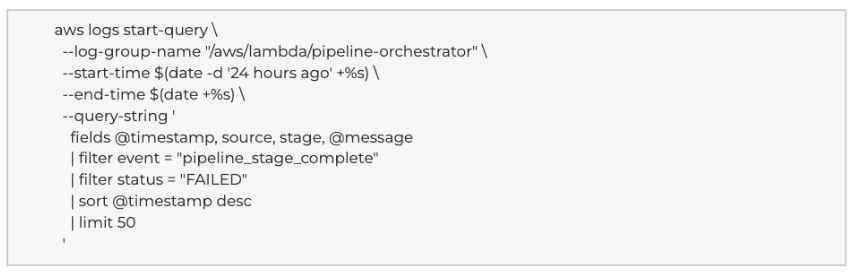
6. Composite Cost Model: Full CloudTrail vs. Targeted Approach
The following estimates compare the monthly cost of ingesting all CloudTrail events into DynamoDB versus the targeted polling approach used in dev. Assumes a moderately active account generating 50 million CloudTrail events per day, with an average event size of 2 KB.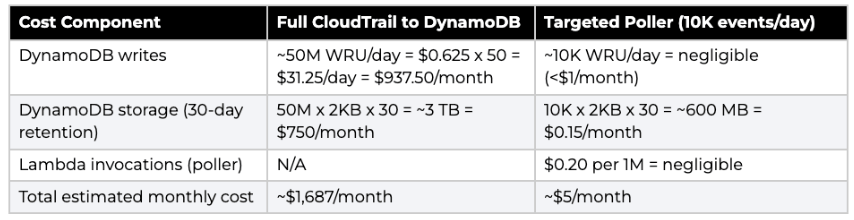
The targeted approach reduces CloudTrail-related DynamoDB costs by approximately more than 90% compared to full ingestion, while still capturing the security-relevant subset of events needed for access auditing dashboards.
7. Operational Considerations
7.1 Retry and Error Handling
The retry pipeline state machine runs every 15 minutes, scanning the failed_jobs table for records with PENDING_RETRY status. Eligible records are resubmitted to the main ETL pipeline. After a configurable number of retries, records move to the quarantine table for manual review. SQS FIFO dead letter queues capture messages that exceed the maxReceiveCount threshold, providing a secondary recovery path.
7.2 TTL and Data Lifecycle
The pipeline-logs table applies a 90-day TTL (configurable via the JOB_TTL_DAYS environment variable). After 90 days, DynamoDB automatically removes expired records. The Zero-ETL integration replicates TTL deletions to Redshift, where the _record_is_active flag transitions to FALSE. Stored procedures filter on _record_is_active = TRUE to exclude expired records from flat table inserts.
7.3 Security Boundaries
- Lambda functions have scoped IAM policies: read-only to source systems, write to their specific DynamoDB table.
- Step Function roles can invoke only their designated Lambda functions and access their designated DynamoDB tables via SDK integrations.
- Redshift Serverless is not publicly accessible, requires SSL, and routes all traffic through the VPC.
- LakeFormation federated grants restrict BI roles to read-only access on the bi_reports schema.
- Amazon Quick connects through a private VPC connection with a dedicated security group.
- SQS FIFO queues use server-side encryption and IAM policies scoped to the consumer Lambda role.
7.4 Monitoring and Alerting
GuardDuty findings at HIGH and MEDIUM severity trigger EventBridge rules that route to SNS topics. Step Function execution failures emit CloudWatch metrics that can trigger alarms. SQS DLQ depth is monitored through CloudWatch ApproximateNumberOfMessagesVisible, with alarms at thresholds indicating stuck pipelines. The Amazon Quick dashboards themselves serve as a visual monitoring layer, with the ETL Failed Jobs dashboard acting as the primary triage surface for pipeline health.
7.5 Zero-ETL Integration Monitoring
The DynamoDB Zero-ETL integration exposes replication lag metrics through CloudWatch. Monitoring the ReplicationLatency metric ensures that Redshift flat tables reflect recent DynamoDB writes within an acceptable window. If replication lag exceeds the stored procedure refresh interval, dashboard data may appear stale. Alarms on replication lag should fire before stored procedures run so that operators can investigate before downstream consumers are affected.
Conclusion
Part 3 of the series has demonstrated how the serverless AWS pattern for ETL logging scales from backend orchestration to high-level visualization. By integrating private networking with SPICE-optimized datasets and AI-powered chat agents, organizations can achieve near real-time observability of their data pipelines while maintaining rigorous security boundaries and cost efficiency. This unified framework ensures that technical telemetry translates directly into operational excellence and strategic value.
Furthermore, the end-to-end log tracking architecture implemented at Red Oak Strategic successfully transforms fragmented operational data into a unified, high-fidelity observability layer. By bridging the gap between AWS Step Function-orchestrated pipelines and Amazon Quick-surfaced insights, this framework provides three critical business advantages:
- Operational Excellence: The standardization of telemetry through PipelineLogger and direct DynamoDB integration ensures that every pipeline execution is traceable, auditable, and recoverable.
- Cost Optimization: Moving from raw log ingestion to targeted access event polling and DynamoDB<>Redshift Zero-ETL replication significantly reduces data overhead while maintaining the granularity required for security and compliance.
- Strategic Scalability: The use of Redshift Serverless and SPICE-backed datasets in Amazon Quick allows the observability framework to scale alongside the dev verticals, empowering teams with AI-driven exploration tools and near real-time visibility.
This architecture not only resolves immediate visibility challenges but also establishes a mature, extensible foundation for data governance and operational intelligence, ensuring that Red Oak Strategic remains robust, transparent, and efficient as its data ecosystem grows.
Appendix
The following links point to official AWS documentation relevant to the services and configurations described in this series.
AWS Step Functions Developer Guide https://docs.aws.amazon.com/step-functions/latest/dg/welcome.html
Step Functions: State Machine Logging https://docs.aws.amazon.com/step-functions/latest/dg/cw-logs.html
Step Functions: AWS SDK Service Integrations https://docs.aws.amazon.com/step-functions/latest/dg/supported-services-awssdk.html
Step Functions: DynamoDB Service Integration https://docs.aws.amazon.com/step-functions/latest/dg/connect-ddb.html
Step Functions Pricing https://aws.amazon.com/step-functions/pricing/
AWS Lambda Developer Guide https://docs.aws.amazon.com/lambda/latest/dg/welcome.html
Lambda: Using SQS as an Event Source https://docs.aws.amazon.com/lambda/latest/dg/with-sqs.html
Lambda Pricing https://aws.amazon.com/lambda/pricing/
Amazon EventBridge Scheduler User Guide https://docs.aws.amazon.com/scheduler/latest/UserGuide/what-is-scheduler.html
Amazon EventBridge Rules https://docs.aws.amazon.com/eventbridge/latest/userguide/eb-rules.html
Amazon SQS FIFO Queues https://docs.aws.amazon.com/AWSSimpleQueueService/latest/SQSDeveloperGuide/FIFO-queues.html
Amazon SQS Dead-Letter Queues https://docs.aws.amazon.com/AWSSimpleQueueService/latest/SQSDeveloperGuide/sqs-dead-letter-queues.html
Amazon SQS Visibility Timeout https://docs.aws.amazon.com/AWSSimpleQueueService/latest/SQSDeveloperGuide/sqs-visibility-timeout.html
AWS Glue Crawler Configuration https://docs.aws.amazon.com/glue/latest/dg/define-crawler.html
AWS Glue Partition Projection https://docs.aws.amazon.com/athena/latest/ug/partition-projection.html
AWS Lake Formation Permissions https://docs.aws.amazon.com/lake-formation/latest/dg/lf-permissions-reference.html
Lake Formation: Granting Permissions on Redshift Resources https://docs.aws.amazon.com/lake-formation/latest/dg/redshift-granting.html
Amazon DynamoDB Developer Guide https://docs.aws.amazon.com/amazondynamodb/latest/developerguide/Introduction.html
Amazon DynamoDB Pricing https://aws.amazon.com/dynamodb/pricing/
DynamoDB Zero-ETL Integration with Redshift https://docs.aws.amazon.com/amazondynamodb/latest/developerguide/RedshiftforDynamoDB.html
DynamoDB: Enabling Point-in-Time Recovery https://docs.aws.amazon.com/amazondynamodb/latest/developerguide/PointInTimeRecovery_Howitworks.html
DynamoDB On-Demand Capacity https://docs.aws.amazon.com/amazondynamodb/latest/developerguide/HowItWorks.ReadWriteCapacityMode.html
DynamoDB Time to Live (TTL) https://docs.aws.amazon.com/amazondynamodb/latest/developerguide/TTL.html
Amazon Redshift Serverless Overview https://docs.aws.amazon.com/redshift/latest/mgmt/serverless-whatis.html
Redshift Serverless: Workgroups and Namespaces https://docs.aws.amazon.com/redshift/latest/mgmt/serverless-workgroup-namespace.html
Redshift Serverless Pricing https://aws.amazon.com/redshift/pricing/
Redshift Enhanced VPC Routing https://docs.aws.amazon.com/redshift/latest/mgmt/enhanced-vpc-routing.html
Redshift: Querying SUPER Data Type https://docs.aws.amazon.com/redshift/latest/dg/query-super.html
Redshift Stored Procedures https://docs.aws.amazon.com/redshift/latest/dg/stored-procedure-create.html
Redshift SECURITY DEFINER Procedures https://docs.aws.amazon.com/redshift/latest/dg/stored-procedure-security.html
Redshift Data API https://docs.aws.amazon.com/redshift/latest/mgmt/data-api.html
Amazon Quick VPC Connections https://docs.aws.amazon.com/quicksight/latest/user/working-with-aws-vpc.html
QuickSight: Connecting to Amazon Redshift https://docs.aws.amazon.com/quicksight/latest/user/create-a-data-set-redshift.html
Quick SPICE and Data Refresh https://docs.aws.amazon.com/quicksight/latest/user/refreshing-imported-data.html
Amazon Quick Pricing https://aws.amazon.com/quicksight/pricing/
QuickSight: Publishing Dashboards https://docs.aws.amazon.com/quicksight/latest/user/creating-a-dashboard.html
QuickSight: Managing SPICE Capacity https://docs.aws.amazon.com/quicksight/latest/user/managing-spice-capacity.html
Amazon Q in Quick (Chat Agents) https://docs.aws.amazon.com/quicksight/latest/user/amazon-q-in-quicksight.html
AWS CloudTrail User Guide https://docs.aws.amazon.com/awscloudtrail/latest/userguide/cloudtrail-user-guide.html
AWS CloudTrail Pricing https://aws.amazon.com/cloudtrail/pricing/
Amazon GuardDuty User Guide https://docs.aws.amazon.com/guardduty/latest/ug/what-is-guardduty.html
AWS Secrets Manager User Guide https://docs.aws.amazon.com/secretsmanager/latest/userguide/intro.html
VPC Security Groups https://docs.aws.amazon.com/vpc/latest/userguide/vpc-security-groups.html
Amazon S3 Pricing https://aws.amazon.com/s3/pricing/
AWS IAM Identity Center (SSO) https://docs.aws.amazon.com/singlesignon/latest/userguide/what-is.html
Redshift Stored Procedure Security Model https://docs.aws.amazon.com/redshift/latest/dg/stored-procedure-security-and-privileges.html
Scheduling Queries in Redshift Query Editor v2 https://docs.aws.amazon.com/redshift/latest/mgmt/query-editor-schedule-query.htm
Contact Red Oak Strategic

Data
Introduction This is the second installment of a three-part technical series detailing the end-to-end observability and log tracking archite...
.png)
Analytics
AWS Summit 2026 Reflection: From Possibility to Production Execution Last year at AWS Summit in Washington, DC, the AI conversation still ha...


Data
Introduction This is the first installment of a three-part technical series detailing the end-to-end observability and log tracking architec...